Форум
Вимірюй, Аналізуй, Контролюй ... запитуй, відповідай, радь.

 управление аналоговыми данными
Ciao a tutti, ho un problema con la gestione dei dati analogici. L'unità centrale raccoglie i dati analogici in volt, che corrispondono esattamente alla percentuale di apertura della valvola. L'apertura della valvola al 100% corrisponde ad una portata di 20 m³/ora.
Esempio:
dati raccolti 1,97 V = 19,7%
100% = 20 m³/ora
Ho difficoltà a creare dashboard coerenti, soprattutto nel calcolo dei consumi periodici, non capisco come gestire i consumi.
Ho notato che recuperando i dati "mensili", il valore su cui si basa il calcolo è il valore medio del volt, ad esempio 0,4 V. E se lo moltiplico per 20 m³, il risultato non è corretto.
Qualcuno può aiutarmi?


Индексация тарифов
Тарифы на электроэнергию меняются раз в полгода. Как менять текущий тариф понятно, но в этом случае пересчитается и статистика за предыдущие периоды?! Как оставить историю не тронутой? Иначе истинные расходы за прошлые периоды будут не корректными!

To calculate a new tariff without losing data for the previous period, you need to make a complex expression.
- In the widget settings, in the Arithmetic operation select f(x)
- click on the Edit icon and set the conditions:
d.TIME < new Date(2022,0,1) ? d.Ch1*0.05 :
d.TIME < new Date(2023,0,1) ? d.Ch1*0.06 :
d.Ch1*0.07;
where
new Date(2023,0,1) is January 1, 2023
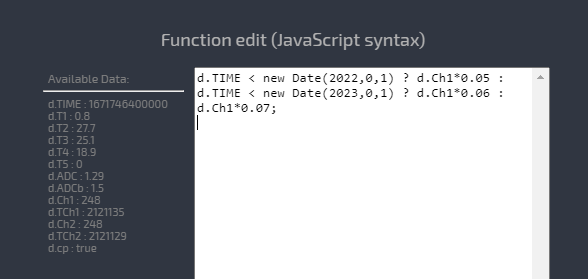
before January 1, 2022 at the rate of 0.05
before January 1, 2023 at the rate of 0.06
everything will continue at the rate of 0.07
Replace the values with your tariff accordingly.
With each tariff change, you can add a new line of conditions in the same format new Date(Year, Month, Day).
Note that the month starts at 0. (0 - January, 1 - February, ... , 11 - December.)
 Уведомления
Здравствуйте, планируется ли у вас добавить функционал Уведомлений ?
например отправку уведомлений (смс, push на телефон, почта, telegram и т.д...) при определенных условиях ?
например: если W Power < 50 wt то отправить сообщение "выключился осушитель"
я в гараже поставил осушитель воздуха, когда он наполнит свой бак 3,6 литра я не знаю, это зависит от влажности и прочих условий, но когда бак наполнится, то осушитель выключится и потребляемая мощность упадет... и нужно поехать в гараж и вылить воду...
думаю, что данный функционал очень созвучен вашему девизу "Измеряй, Анализируй, Контролируй" =)

Using html text to create a link
So within the widget selection you can add text box with picture also notice it allows use of html. I am trying to find a way of using this as button to swap between dashboards but the problem is how do you separate address for the different dashboards. I have tried to use the share dashboard function and copy the link from this but this does not seem to work. Does anyone have any luck any idea or ways to do this
Служба підтримки клієнтів працює на UserEcho
