Forum
Measure, Analyze, Control ... ask, answer, suggest.

 Зовнішня температура
Доброго дня. Підскажіть будь ласка, чи є можливість додати до віджета, який вирахувеє електроенергію, температуру зовнішньго повітря, яка вказується в віджеті погода?

 Як додати лічильник імпульсів за нічну зміну
Як додати лічильник імпульсів за нічну зміну з 20:00 до кінця доби, та до 08:00 нової доби в дашборд, та у Excel

 Watt variable in advanced functions is not showing correct number
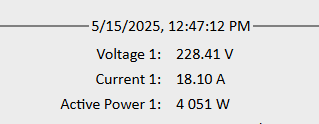
When I check dashboard for my device, it shows around 4kW on L1. This is correct. Same in webpage of the device itself.

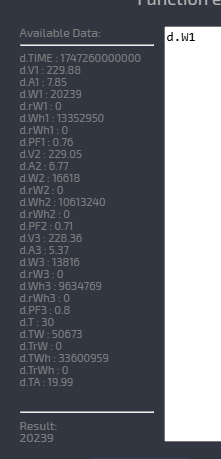
However, if I want to use d.W1 in advanced functions, it shows 20kW.


 Автоматична відправка даних про погодинне споживання за добу(погодинка) на e-mail
Добрий день!
Цікавить можливість зробити автоматичну відправку споживання за добу на e-mail, типу макетів як комерційному обліку.
Чи створення БД для автоматизованого формування споживання, куди буде все відсилатися.
Customer support service by UserEcho


