Forum
Measure, Analyze, Control ... ask, answer, suggest.

 the sum of electricity consumption
Hi,
how can display on dashboard sum of electricity consumption measured by energy meter D103 and pulse meter D105 ? When I create Virtual value, I'm not able to crate a sum values from this two devices.
Thnx. Jiri

 Complete transfer of dashboard and cloud data from one account to another
How can you transfer (not share) the entire dashboard with its cloud data registered in an account to another account?
Basically perform an account change while keeping the entire dashboard with its settings and cloud data connected to it unchanged.

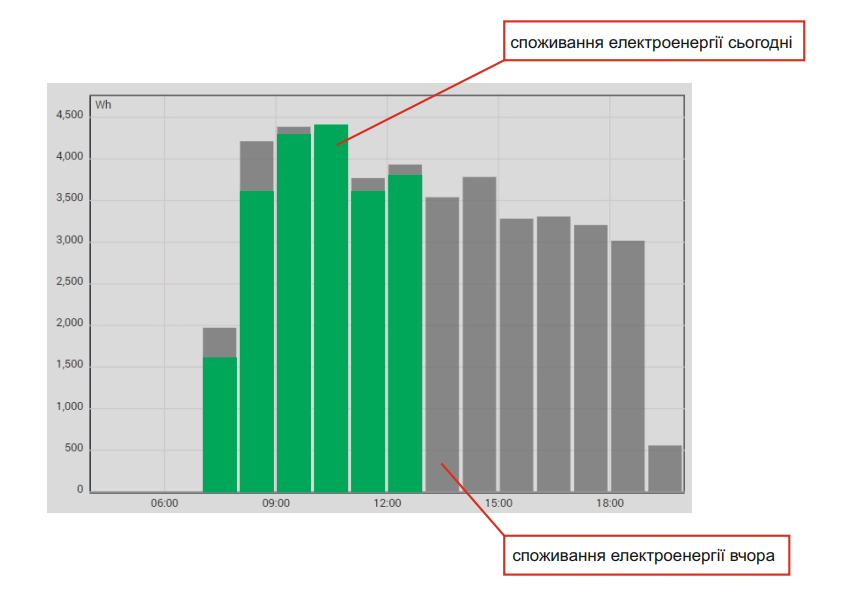
 накладання графіка сьогодні на графік вчора
Добрий день,
В процесі користування сервісом, виникла потреба порівнювати споживання електроенергії по двом календарним дням - "сьогодні" та "вчора", з можливістю відображення накладених графіків один на одного в режимі онлайн. Бачити споживання за попередній день тієї ж години гістаграмою, наприклад сірого кольору на фоні миттєвого споживання - більш яскравим кольором.
Чи можливо впровадити таку функцію у дашборді?


 Filter data by Power
Hello,
I need to create a graph with the total power for each day, but i need to be able to filter by power absorbed in period.
For example, I have a load that consumes 3KW in standby and >10KW when working.
I would like a total of the kW consumed in the periods below 5kw and one above.
Is it possible to do this with the dashboard tools?
Thank a lot!!
Massimo.

 axis scale
How can I change the scale of the axis? For example, I measure a Voltage of 5 Volts. Until 2 days ago, the right axis had (automatically) a maximum range of 5. Since yestrday, the maximum value of the axis is 50 Volt, therefore the height of my voltage-line is only 10 percent of the height of the screen. Thank you and best regards Kurt Böhm
Customer support service by UserEcho

