Форум
Вимірюй, Аналізуй, Контролюй ... запитуй, відповідай, радь.

 Налаштування день.ніч
Доброго дня!
Я хочу налаштувати два віджети на дашборді:
- Віджет для відображення тарифу
Я хочу, щоб віджет відображав змінний тариф залежно від часу доби. Наприклад:- Якщо зараз 10:00 ранку, на дашборді має бути значення 4.32.
- Якщо 03:00 ночі, тариф має бути 2.16.
- Віджет для загальних показників та день і ніч
Я вже синхронізував дані з лічильником (у ватах), і тепер на дашборді відображаються правильні загальні показники. Тепер хочу додати ще показники день і ніч, й відображення орієнтовних коштів з урахуванням тарифу (день/ніч).
Я прочитав форум і намагався налаштувати це самостійно, але виникли питання. Скріни на форумі не зовсім повні, тому не зовсім зрозуміло, як правильно налаштовувати "віртуальні значення".
Моя гіпотеза, що потрібно створити 3 об'єкти віртуального значення:
- Тарифи – де тариф залежить від часу (коефіцієнт по годинах).
- Зона день – де ми виставляємо коефіцієнт 1 для годин вдень.
- Зона ніч – де ми виставляємо коефіцієнт 1 для годин вночі.
Однак я не розумію, що саме потрібно вибирати в розділі "Пристрій" і "Дані" під час налаштування віртуальних значень. Також не зовсім зрозуміло, чи потрібно додавати символи в цих налаштуваннях.
Можете, будь ласка, уточнити, які параметри потрібно вибрати для коректного налаштування дашборду?
Дякую за допомогу!

Relay status
Is it possibile to check relay status (ON-OFF) of D101 on a widget in the dashboard?
Thanks
Carlo

the sum of electricity consumption
Hi,
how can display on dashboard sum of electricity consumption measured by energy meter D103 and pulse meter D105 ? When I create Virtual value, I'm not able to crate a sum values from this two devices.
Thnx. Jiri

Complete transfer of dashboard and cloud data from one account to another
How can you transfer (not share) the entire dashboard with its cloud data registered in an account to another account?
Basically perform an account change while keeping the entire dashboard with its settings and cloud data connected to it unchanged.

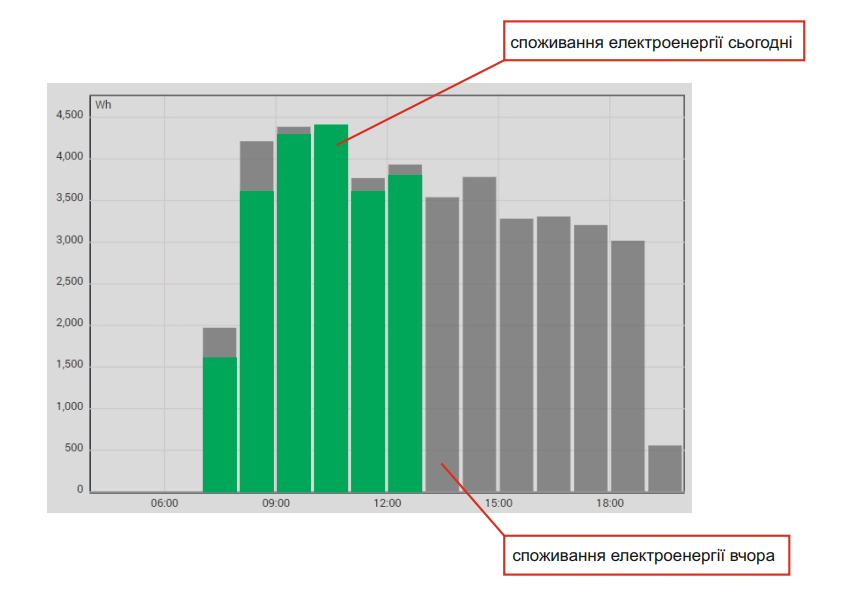
накладання графіка сьогодні на графік вчора
Добрий день,
В процесі користування сервісом, виникла потреба порівнювати споживання електроенергії по двом календарним дням - "сьогодні" та "вчора", з можливістю відображення накладених графіків один на одного в режимі онлайн. Бачити споживання за попередній день тієї ж години гістаграмою, наприклад сірого кольору на фоні миттєвого споживання - більш яскравим кольором.
Чи можливо впровадити таку функцію у дашборді?
Служба підтримки клієнтів працює на UserEcho
