Форум
Вимірюй, Аналізуй, Контролюй ... запитуй, відповідай, радь.

 Using html text to create a link
So within the widget selection you can add text box with picture also notice it allows use of html. I am trying to find a way of using this as button to swap between dashboards but the problem is how do you separate address for the different dashboards. I have tried to use the share dashboard function and copy the link from this but this does not seem to work. Does anyone have any luck any idea or ways to do this

 Water Flow Sensor
Hello, don't you have water flow sensor greater than DN25, like DN40 or DN50?

 Управляемый выход
Нигде не нашёл информацию про Управляемый выход, кроме 'мощность не более 50 Вт' :(
Вопрос, что на выходе? Сухой контакт или напряжение? Если напряжение, то сколько вольт?
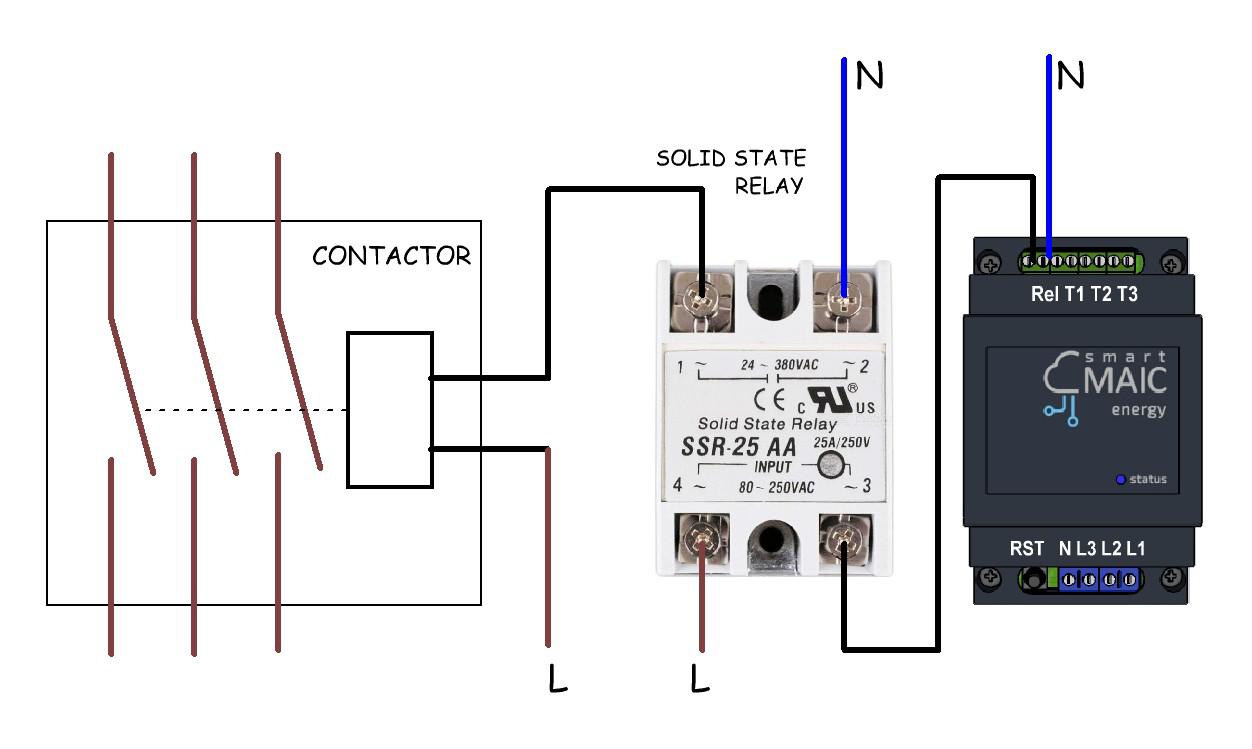
Хочу подключить твердотельное реле, типа такого https://www.ab-log.ru/smart-house/ethernet/megad-2561-ssr

В мануале есть раздел "УСЛОВИЯ и УВЕДОМЛЕНИЯ"
https://support.smart-maic.com/communities/1/topics/25-gde-mozhno-skachat-instruktsiyu
Если надо управлять мощной нагрузкой через контактор, то управляйте контактором через дополнительное твердотельное реле, которое будет как фильтр работать.

 Керування навантаженням та умови
Доброго дня. Чи можливо зробити керування навантаженням через дашбоард приорітетним над заданими умовами? Можливо добавити у віджеті пункт "Вімкн/вимкн налаштовані умови" або щось подібне.
Наприклад: є задані умови відключати реле з 20:00 до 7:00 на постійній основі, але виникла ситуація що необхідно залишити ввімкнутим. В даний час це не можливо, так як одразу після переведення перемикача керування навантаженням в дашборді в положення "ON", в період з 20:00 до 7:00, пристрій через секунду все рівно починає виконувати встановлені умови і переходить в положення "OFF" .

В мануале есть раздел "УСЛОВИЯ и УВЕДОМЛЕНИЯ"
https://support.smart-maic.com/communities/1/topics/25-gde-mozhno-skachat-instruktsiyu
Если надо управлять мощной нагрузкой через контактор, то управляйте контактором через дополнительное твердотельное реле, которое будет как фильтр работать.


 D103-2000 некорректные показания
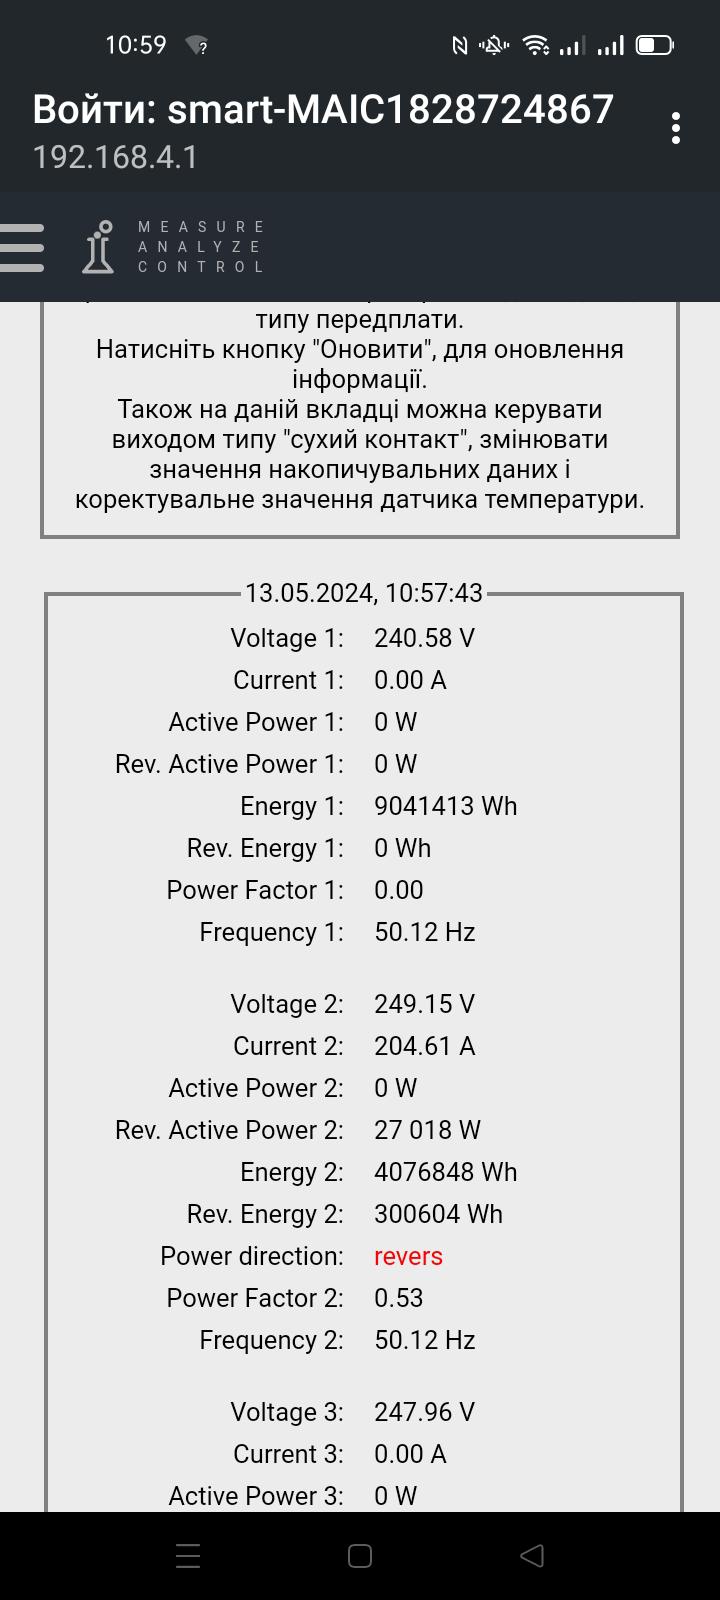
После установки прибора в ТП появились некорректные показания тока по второй фазе. До этого все работало нормально в тестовом режиме в другом месте. Ток по этой фазе всегда порядка 200А, power direction - revers, power factor гуляет от 0.24 до 0.70. Сначала подумал на неправильную установку датчика тока - перевернул, но результат тот же, ничего не поменялось. Данные показания висят даже если нет нагрузки и ток по другим фазам 0. В чем может быть причина? Какие параметры у данных датчиков тока, что должно быть на выходе? Замерял напряжение на клеммнике, у нормальных фаз 150-200 мВ AC в работе, а у этой всего 17-19 мВ AC при одинаковой нагрузке по фазам.

Служба підтримки клієнтів працює на UserEcho

