Форум
Измеряй, Анализируй, Контролируй ... спрашивай, отвечай, советуй.

 Підключення давачів швидкості та напряму вітру
Вітання,
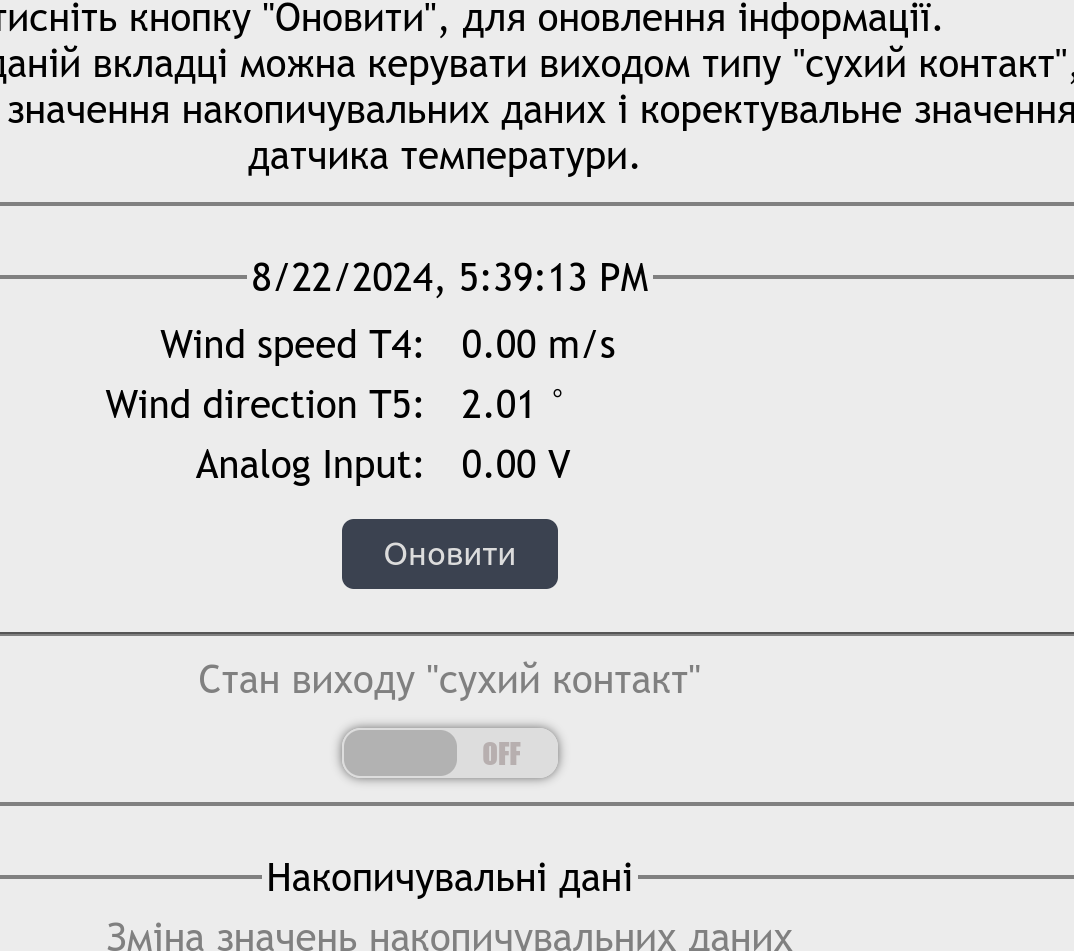
Намагаюсь підключити давачі напряму та швидкості вітру, проте вони обидва звітують дані в Т5:
Чи ви стикались з таким? І як виправити це?

 TOTAL Power
Значение общей мощности превышает значение тока по трем фазам помноженное на 380. К нему добавляется значение реактивной мощности? Так?

Problem exporting data in CSV format
Hi. Please can you advise when i export the data in a csv comma delimited file format why most of the data is not separated into columns. This the first time this is happening.
Regards
Peter

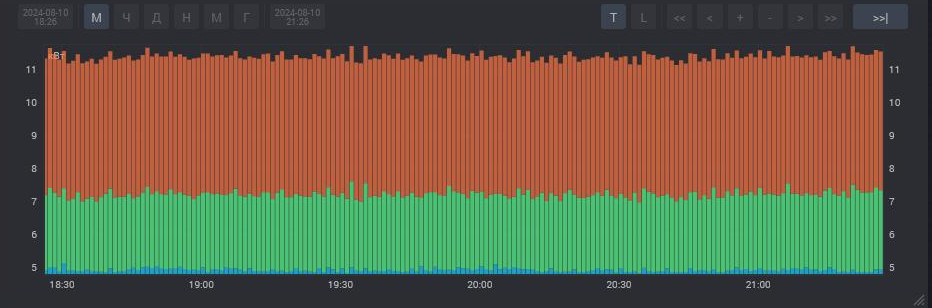
Почему этот график не с нуля? И как сделать его с нуля?
Почему этот график не с нуля? И как сделать его с нуля?

Time based Graph
Hello.
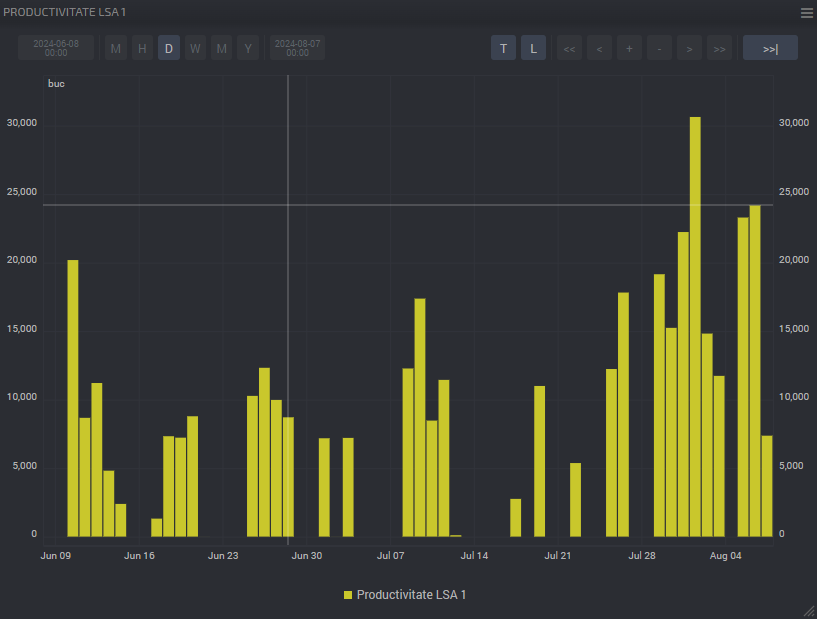
I am using a D105 G4 in pulse counting mode for tracking the output productivity of a stamping machine. The machine is working in 2 schifts daily. Everything is working well, I am getting the total value daily for both shifts that are working on that machine.
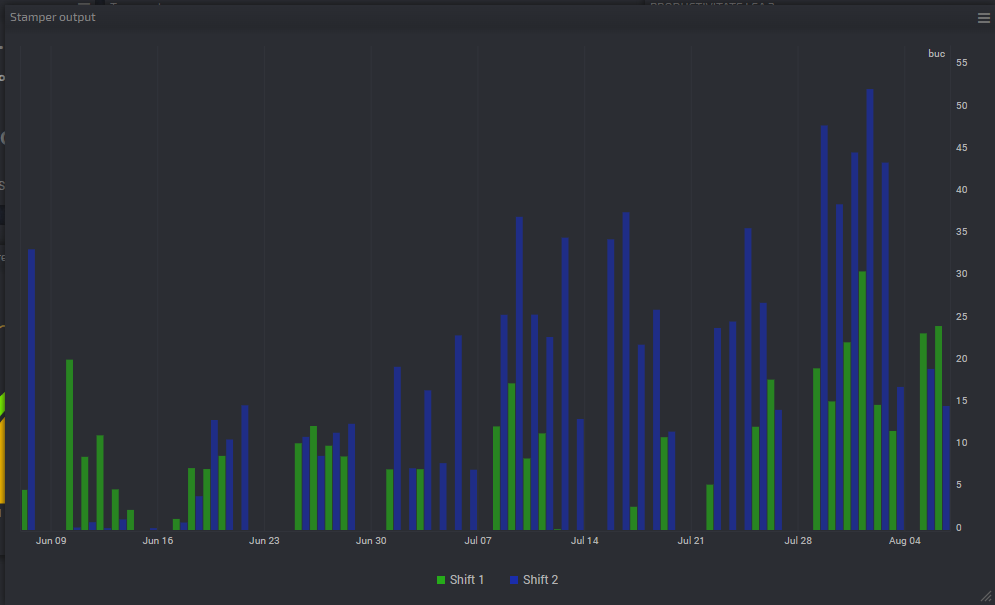
but i want to be able to split the graph into 2 working schedules : 07:00-15:00 and 15:00-23:00, so i can find out wich shift is more productive .
I need some output conditioning by time , or something similar. Can this be done ?
Now I have this :
And would like something like this :
Сервис поддержки клиентов работает на платформе UserEcho