Indicator settings
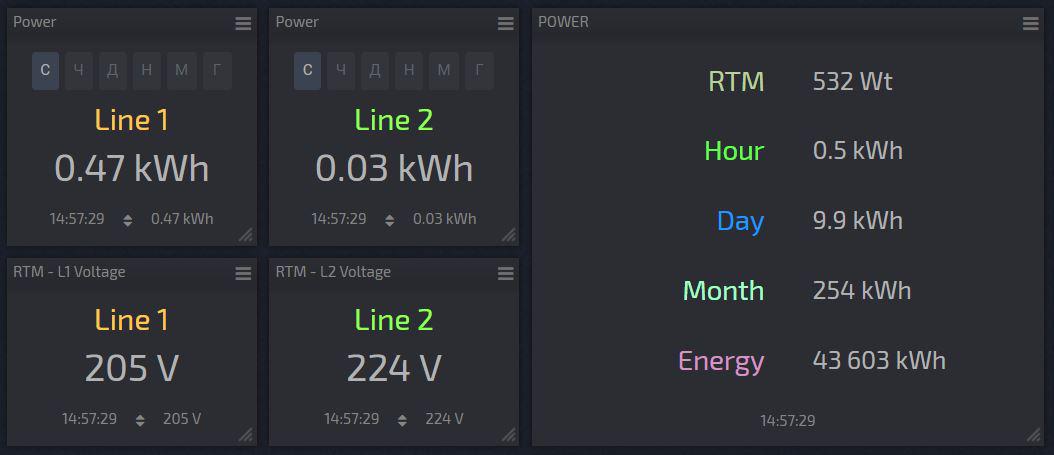
Widgets - indicators are designed to display data in real time.
A new bookmark will be created based on the data from the active bookmark.
To change the order of data on the widget, hook and move the corresponding tab to the desired location.
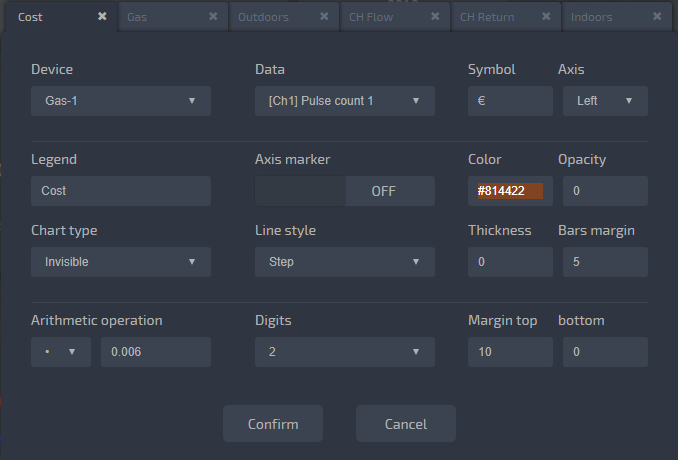
Device
Selecting a device from the list of devices connected to the board.
Data
Selection of data displayed on the indicator.
Period
The period of data display, on some widgets, the period can be changed without going into the settings.
Info-text, Font size, Color
An information text block will be displayed to the left of the data. We define the block itself, font size and color.
Data symbol, Font size, Color
The unit of measurement data is displayed to the right of the data. Font size for data and color data.
Arithmetic operation, Fraction signs
Perform an arithmetic operation, with determining the number of decimal places.
Tip, to display the graph in the negative half-period, simply multiply it by -1, and to convert Wt to kWt, divide by 1000.Show changes
If enabled, the previous data and the data change direction symbol will be displayed at the bottom of the widget.
Enjoy your data!
Customer support service by UserEcho
