Types of charts
Types of graphs. Line and Area.
The Line Style setting applies only to the Linear and Area types.
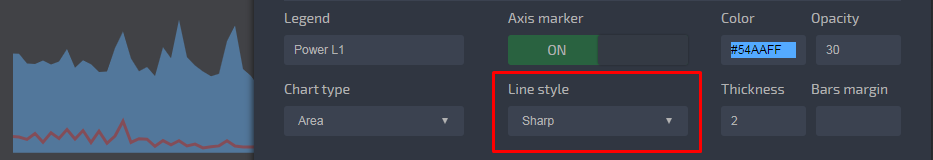
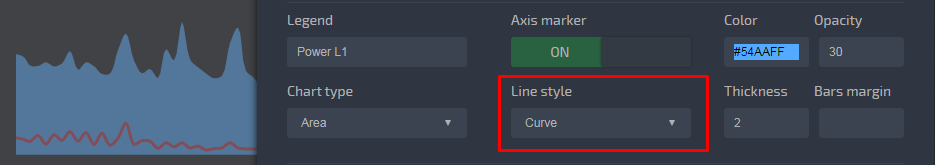
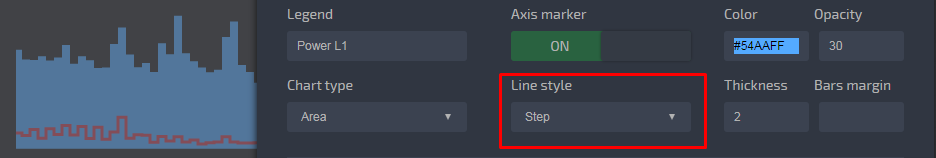
For graphs such as Line and Area, the settings are the same, except for the line thickness.
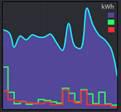
If it is necessary to build the “Area” graph, but with a highlighted top line,
you can build two graphs using the same data: Area and Line.
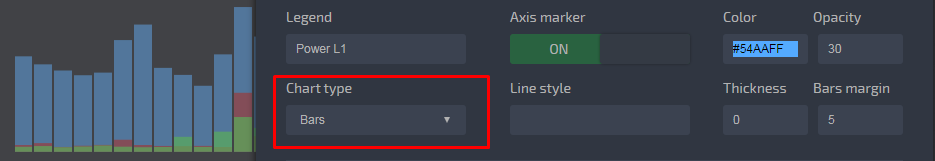
Types of graphs. Bars.
In the "Bars" mode, the bar of each chart occupies the entire width of the date, minus the indents to the left and to the right. Respectively can overlap each other. Change the transparency and order in the graph by dragging the bookmarks.
The order of displaying and overlaying the graphs on each other corresponds to the order of the bookmarks when setting up.
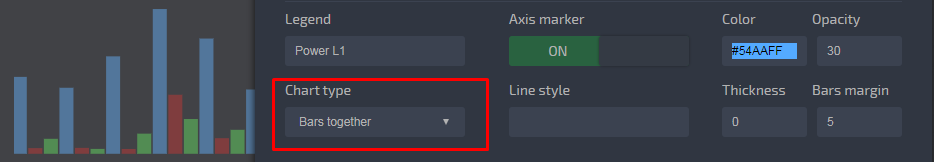
Types of graphs. Bars nearby.
The bars are located near. The gap between them depends on the setting “Fields of bars.
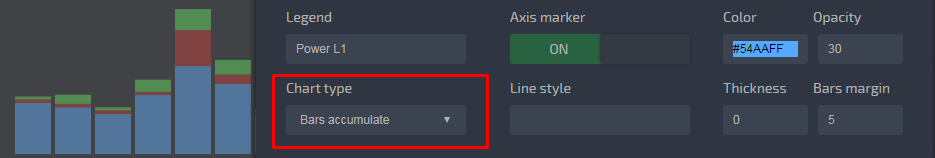
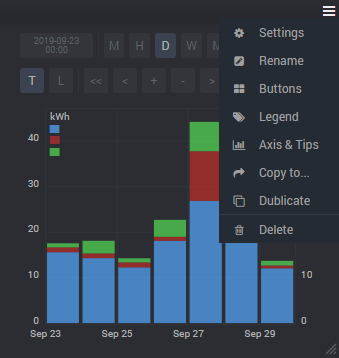
Types of graphs. Bars accumulation.
Bars are located above each other. each next starts from the testimony of the previous one, which ultimately gives the sum of all the data. The gap between them depends on the setting of the “Field of bars”.
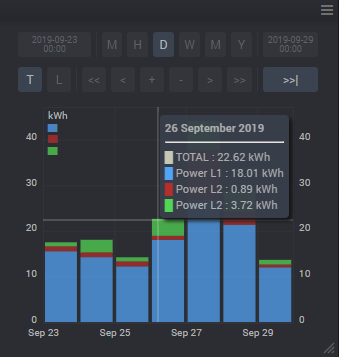
Types of graphs. Invisible.
Data will be displayed only in a tooltip.
It is convenient to use in combination with the “Bars-Accumulation” type, so that the prompt has the total amount in a separate line.
“Buttons” and “Legend” can be turned off and on via the menu, or by pressing the corresponding buttons: B and L
You can control the selected schedule using the keyboard. For the active graphics outline is highlighted.
Rewind: Left, Right
Scale: + and -
Home button turns on real time Now
Enjoy your data!
Customer support service by UserEcho
