Heat pump and COP (Coefficient of Performance)
Monitoring the operation of a Heat Pump (COP)
The COP of a Heat pump it is the coefficient of conversion of electrical energy into heat. COP shows how many kW of heat we received by spending 1 kW of electricity.
Why is COP needed? For example, to determine how much 1 kW of heat energy costs and compare with alternative heating sources. Just divide the cost of 1 kW of electricity by COP and determine the cost of 1 kW of heat produced.
It is easy to compare with gas and electric heating. In modern gas boilers, the ratio Gas : Heat is approximately 1: 10, i.e. the COP of a gas boiler is 10. If we divide the cost of 1 m3 of gas by 10, we get the approximate cost of 1 kW of heat for gas heating. With electric heating, COP is 1, i.e. from 1 kW of electrical energy, 1 kW of thermal energy is obtained, no need to divide.
To determine the COP of a heat pump, it is necessary to know the consumed electrical energy and the generated heat energy. So we need an energy monitor on the electricity consumption line and a heat meter on the heat generation line.
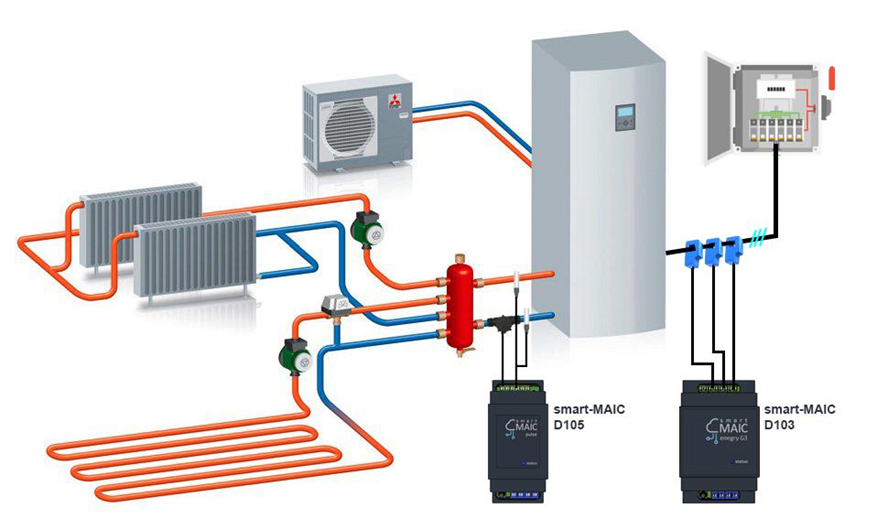
For monitoring of the heat pump operation and determination of COP, we need:
1. Universal pulse counter D105 in heat meter mode, which will count the generated heat energy.
See the related article in the Knowledge Base: Read »
2. Energy monitor D103 on the power supply line of the heat pump, which will count the consumed electrical energy.
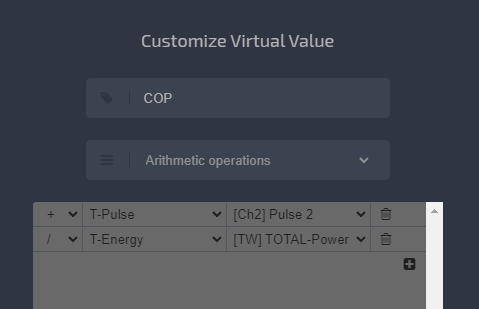
On the Dashboard, it is easy to determine the COP coefficient as the ratio of heat produced to consumed electrical energy. In the Virtual menu, create a virtual value with a simple arithmetic operation:
COP = [Ch2] Heat Energy / [TW] Electric Energy
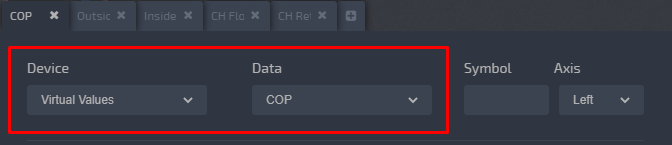
To use a virtual value in the widget settings as a device, select Virtual Values and the created COP virtual data.
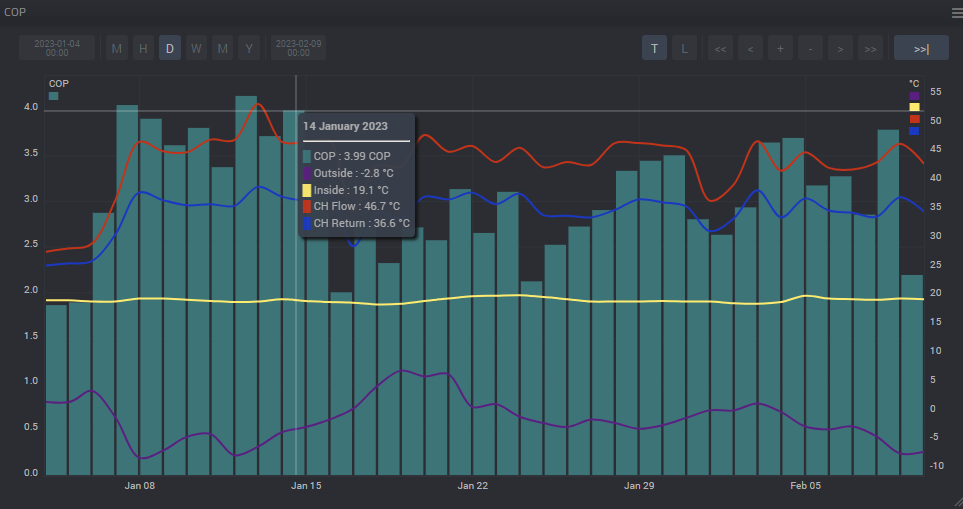
You can add up to ten different values from different devices to one chart, i.e. you can display electricity consumption, heat production, COP, supply and return temperatures, indoor and outdoor temperatures, system pressure, and so on. The main thing is to keep track of the dimension and bind data of similar size to the same axis, left or right, so that the graphs do not fall to zero if the values are too different.
Done.
Customer support service by UserEcho
