Wiring diagram of a Solar plant
Complex monitoring of Solar plant and Households
If the Photovoltaic is installed on the territory of the household, then three points are of interest for complex monitoring:
- point A generation by Photovoltaic
- point B user consumption by your Household
- point C taking Energy from the public grid and D sending Energy to the public grid
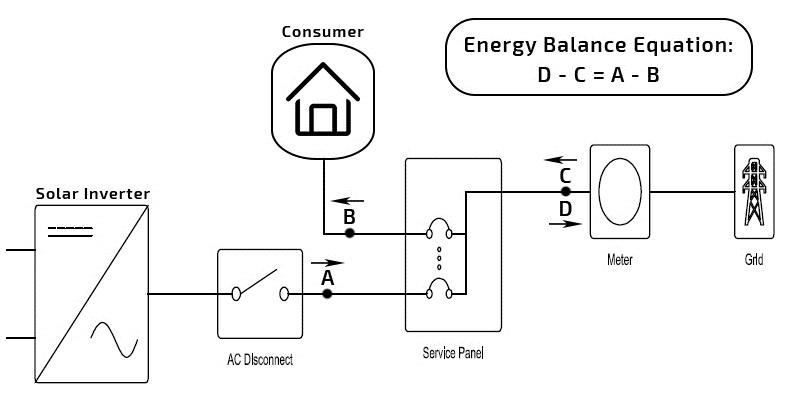
With smart-MAC Energy monitors, it is possible to monitor any of that point.
1. If it installed behind the inverter (A), it will only monitor generated electricity.
2. If it installed on a public grid (C_D), there will be data on the difference between generation and user consumption. For point C_D you need the Extended version of the device.
3. If it installed at the entrance to the house (B), then it will be only controlled on user consumption by the house.
Also, Household consumption (B) can be calculated on the Dashboard using the Energy Balance Equation:
D – C = A – B
B = A + C - D
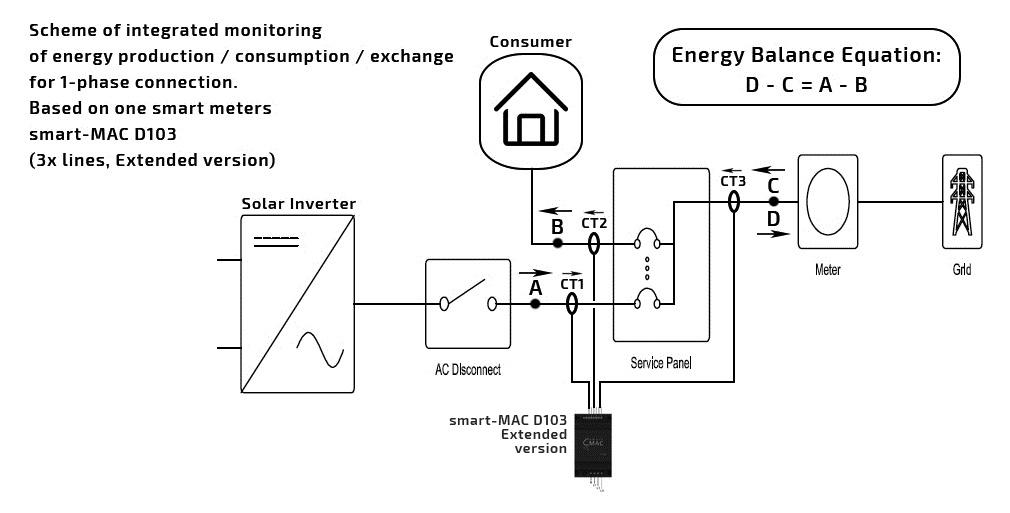
Single Phase Solar Power Monitoring
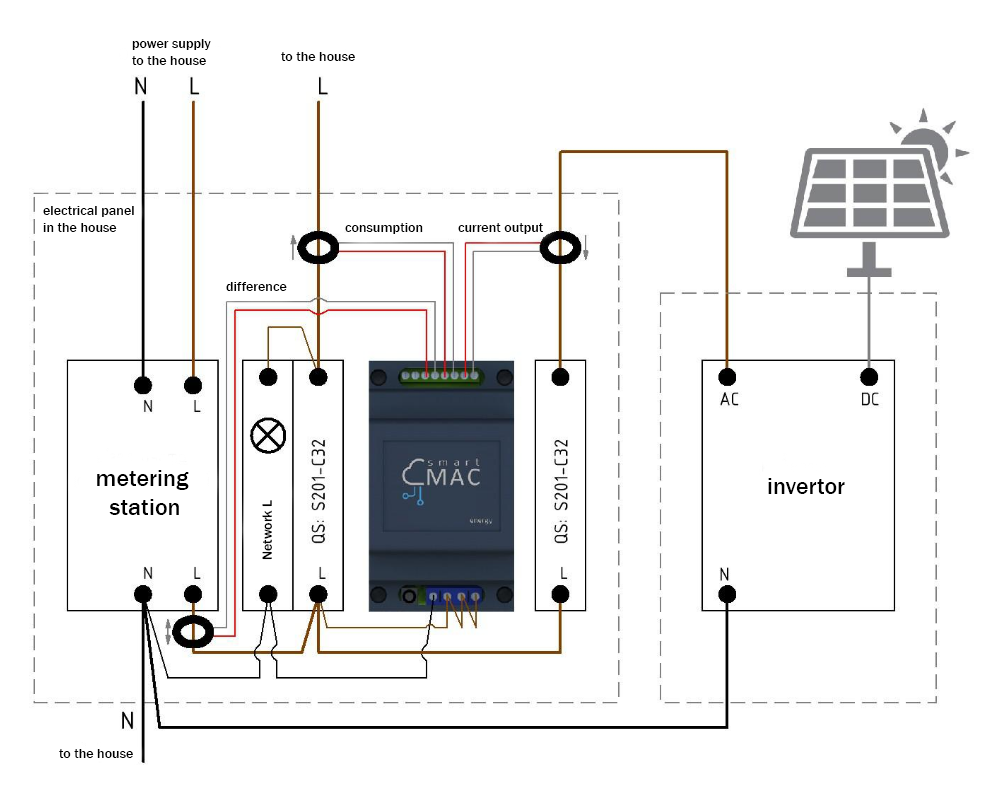
For a complete monitoring of a single-phase grid, one three-line (three-phase) smart-MAIC power meter D103 is required.
The general wiring diagram of an energy monitor in a single-phase grid below.
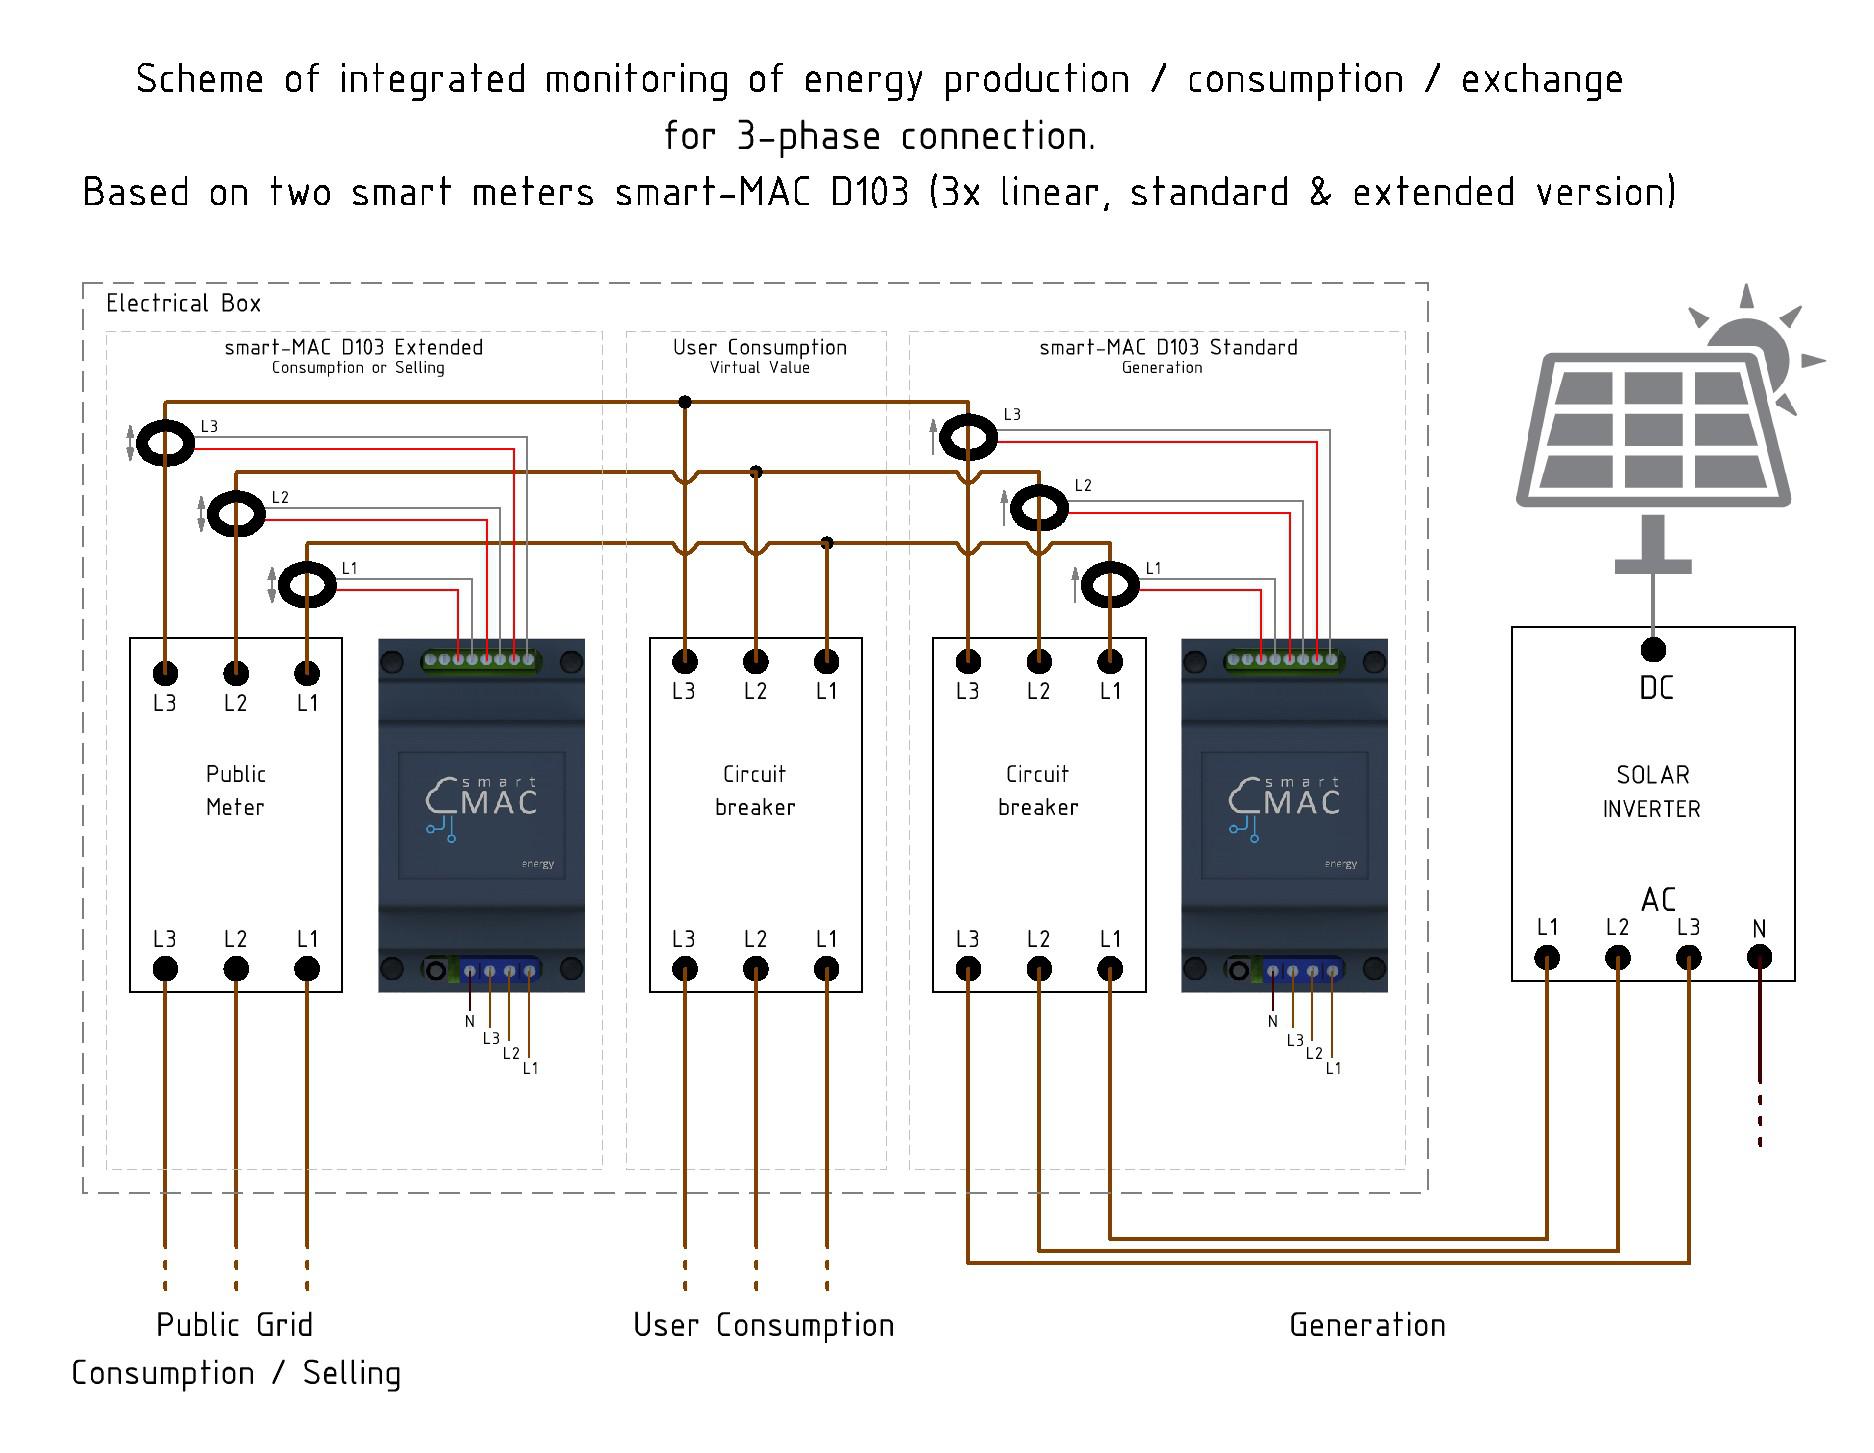
Three Phase Solar Power Monitoring
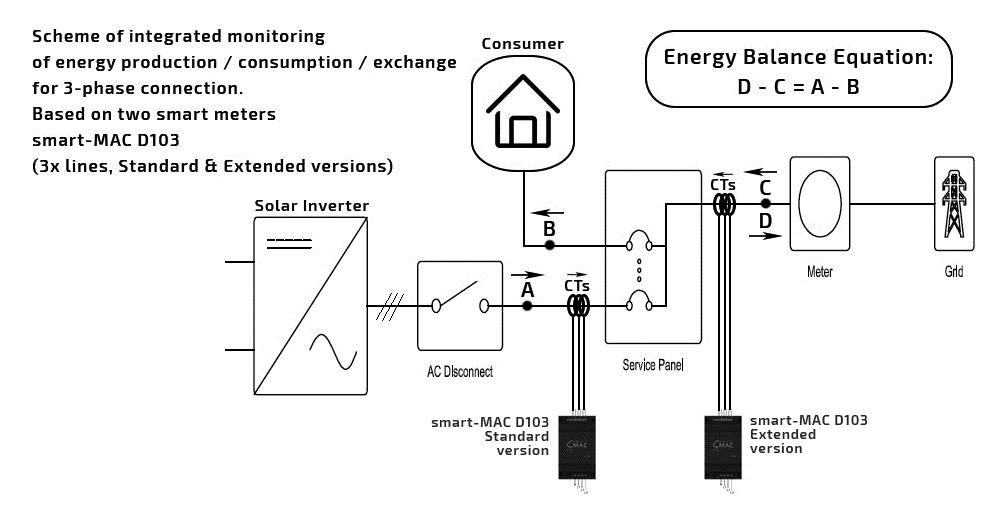
For the integrated monitoring of three-phase grid you need:
- Energy monitor D103-22(12) (3 phase, Extended) - 1 pc.
- Energy monitor D103-21(11) (3-phase, Standard) - 1 pc
The general wiring diagram of power monitors in a three-phase grid below.
Monitoring on the Dashboard
You can create widgets on the Dashboard to display all monitoring points.
Here's an example for Device_A and Device_C_DPoint A: [TW] Total Power from Device_A
Point C: [TW] Total Power from Device_C_D
Point D: [TrW] Total Reverse Power from Device_C_D
To monitor a household (point B), it is necessary to create a virtual value for the energy balance formula:
B = A + C - D
B = Device_A [TW] + Device_C_D [TW] - Device_C_D [TrW]
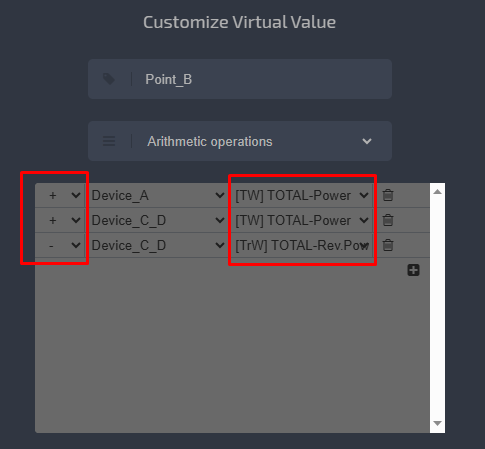
Then use the virtual value on widgets as usual.
Customer support service by UserEcho